Launch Week Day 3: Analytics
- November 8, 2023
- 1 min read
Today we’re super excited to introduce Dopt analytics!
Understanding how your product onboarding and education flows are performing is essential to creating effective flows.
Dopt’s new flow analytics gives insights into how your users are progressing through the onboarding and education experiences you build with Dopt, helping you understand what’s working and fueling iteration.
Our flow analytics answers questions like:
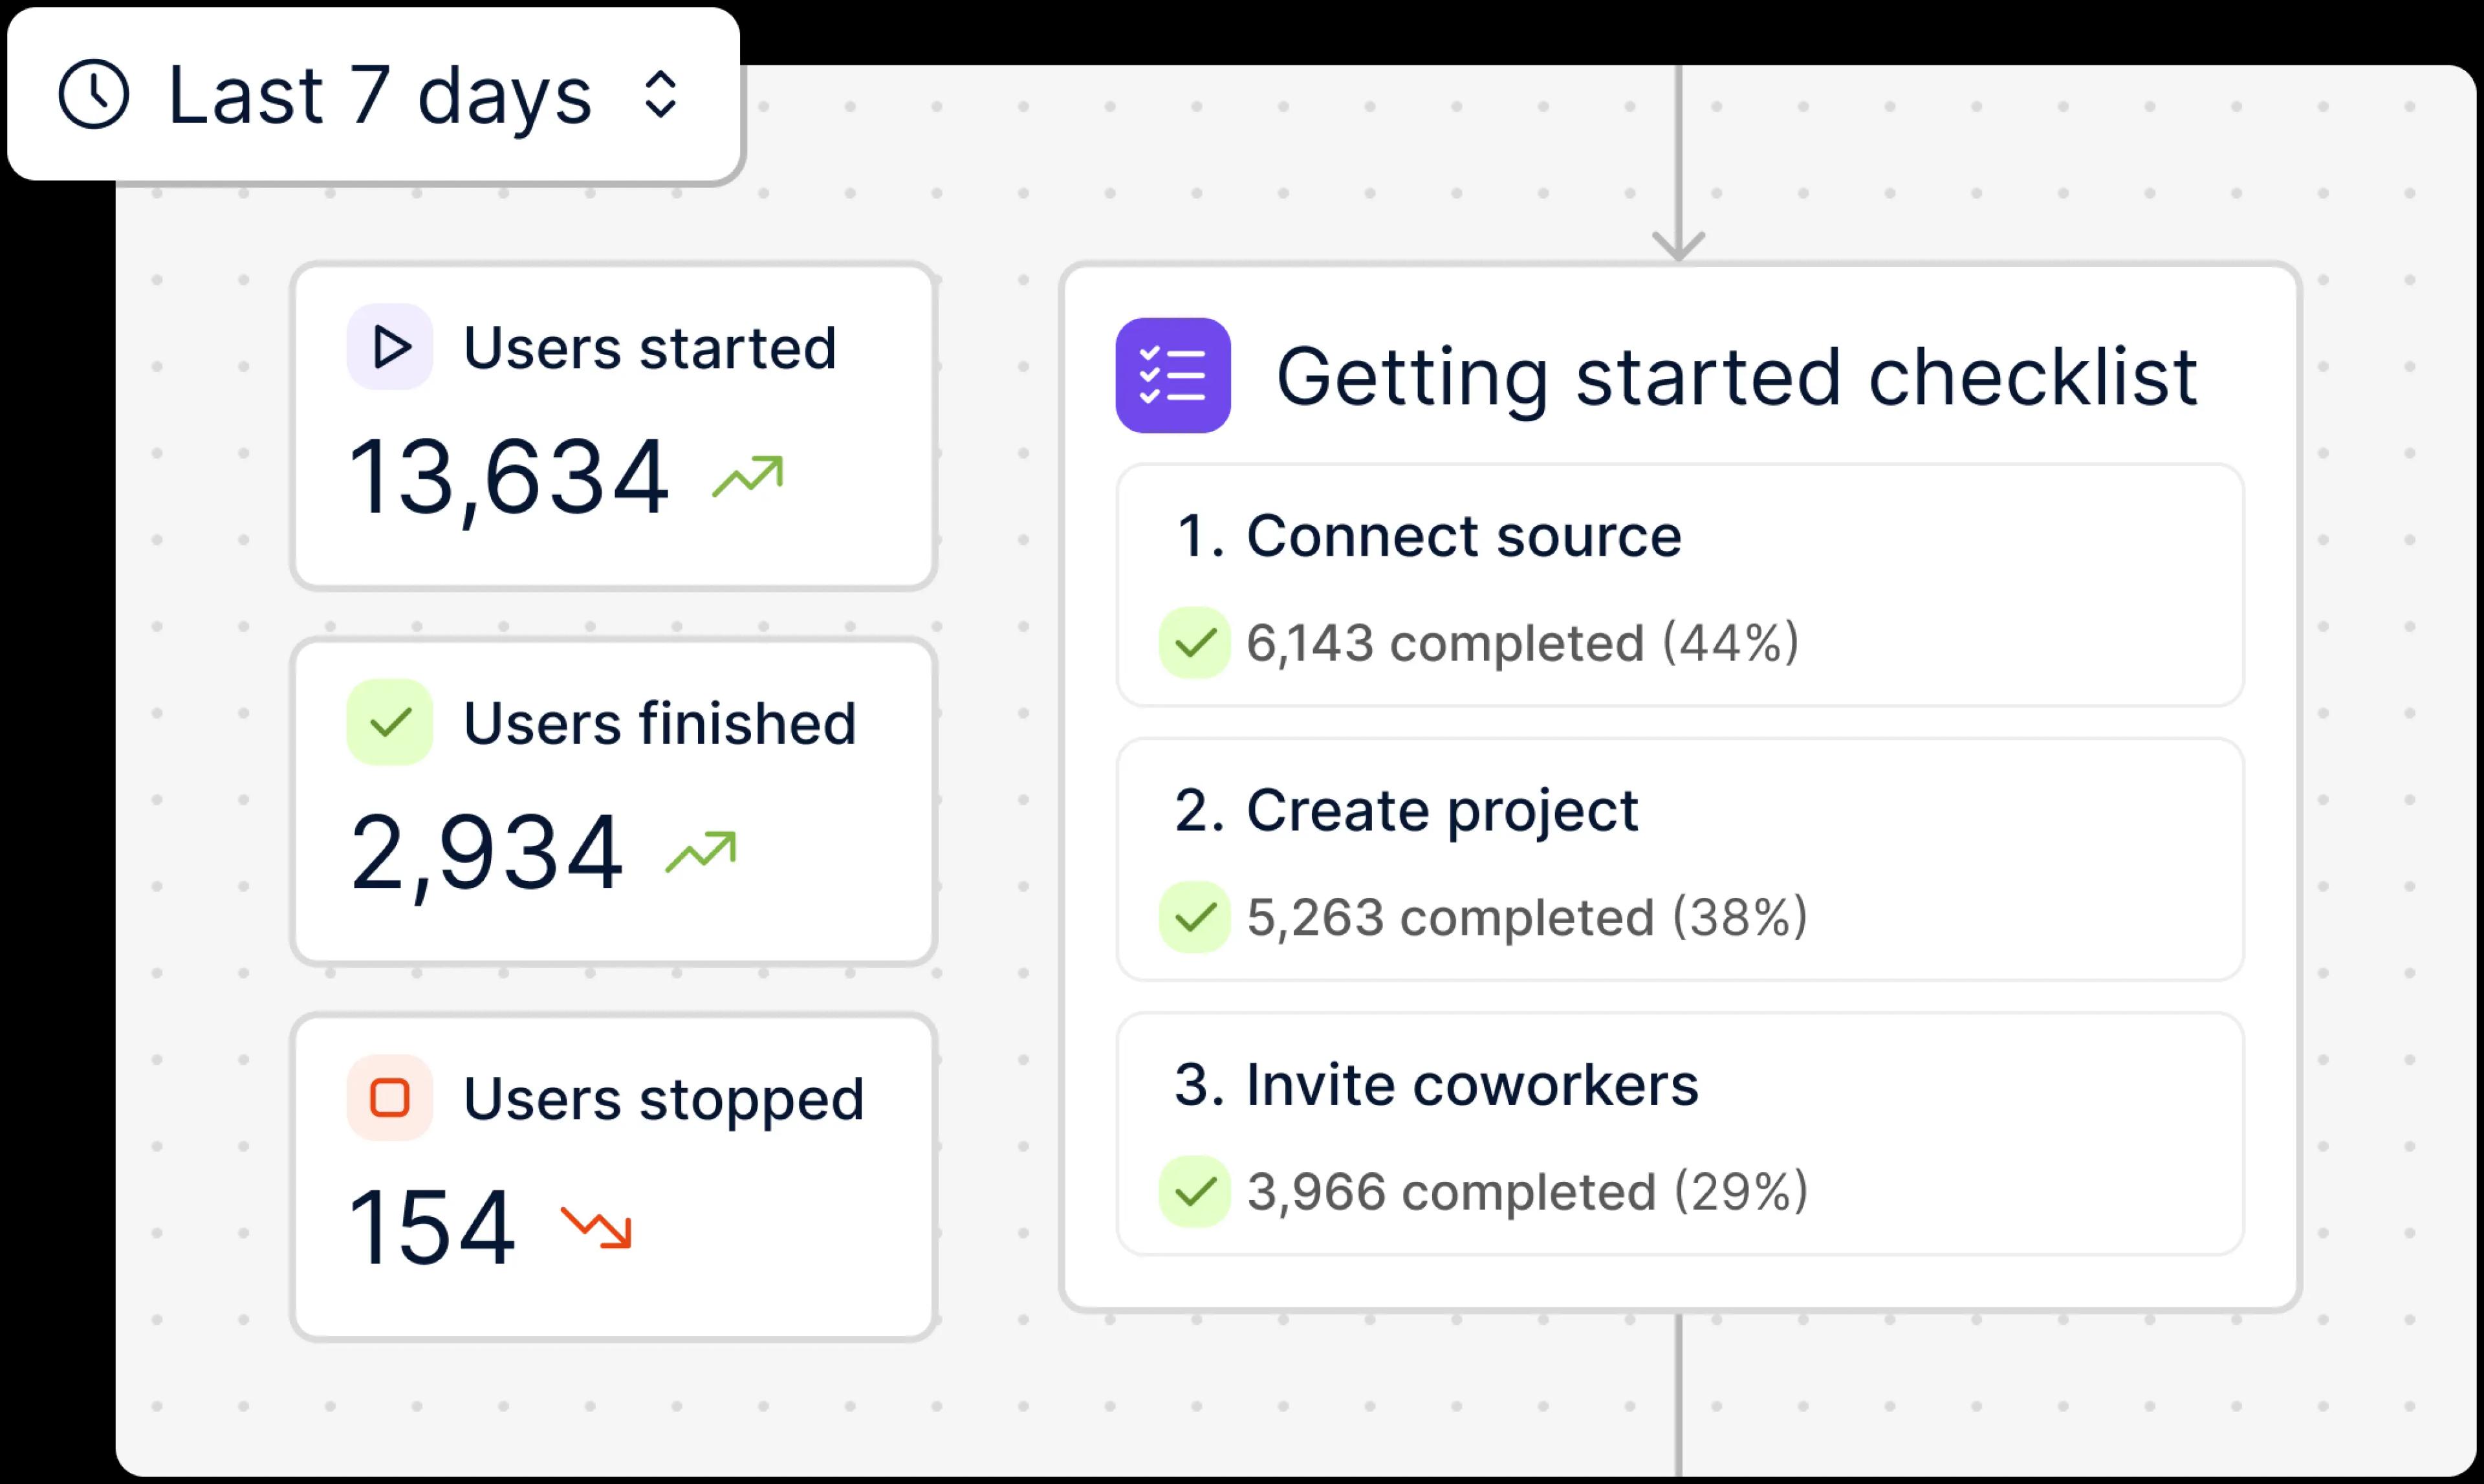
- How many users completed the getting started checklist in the last 7 days?
- When was the biggest drop-off during the create new chart tour?
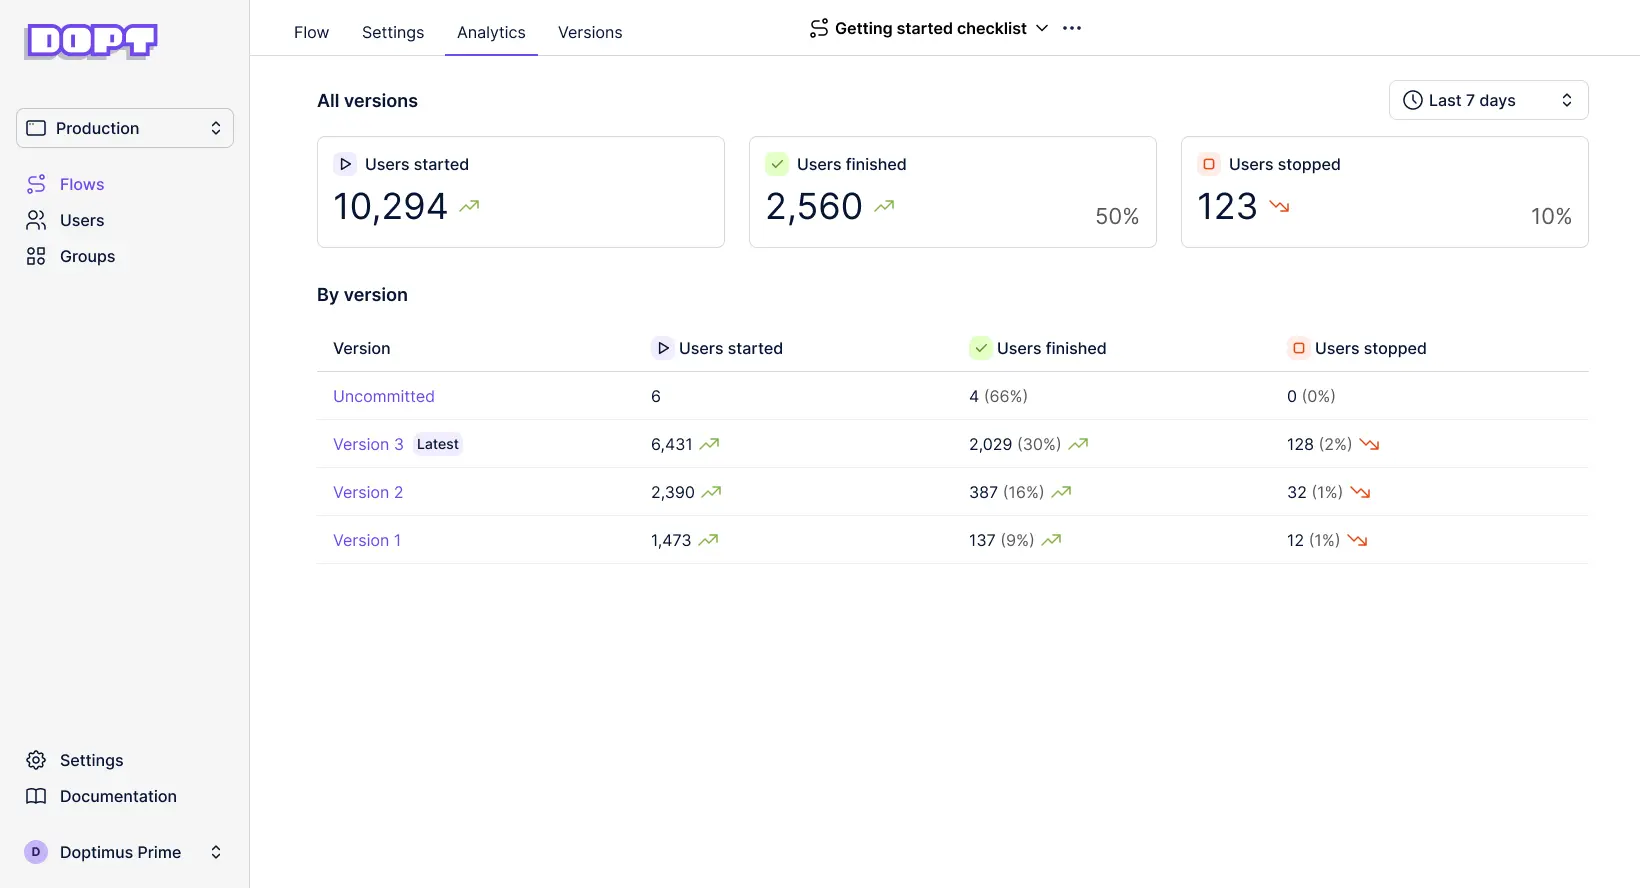
- How did the conversion rate of version 3 compare to version 2?
The flow analytics are completely built-in and out-of-the-box — no analytics instrumentation required. You can also send events to external analytics platforms to power holistic analysis.
Watch Maria, one of our engineers, use the new analytics to understand the performance of a getting checklist started checklist build with Dopt.
Understand flow performance with built-in flow analytics
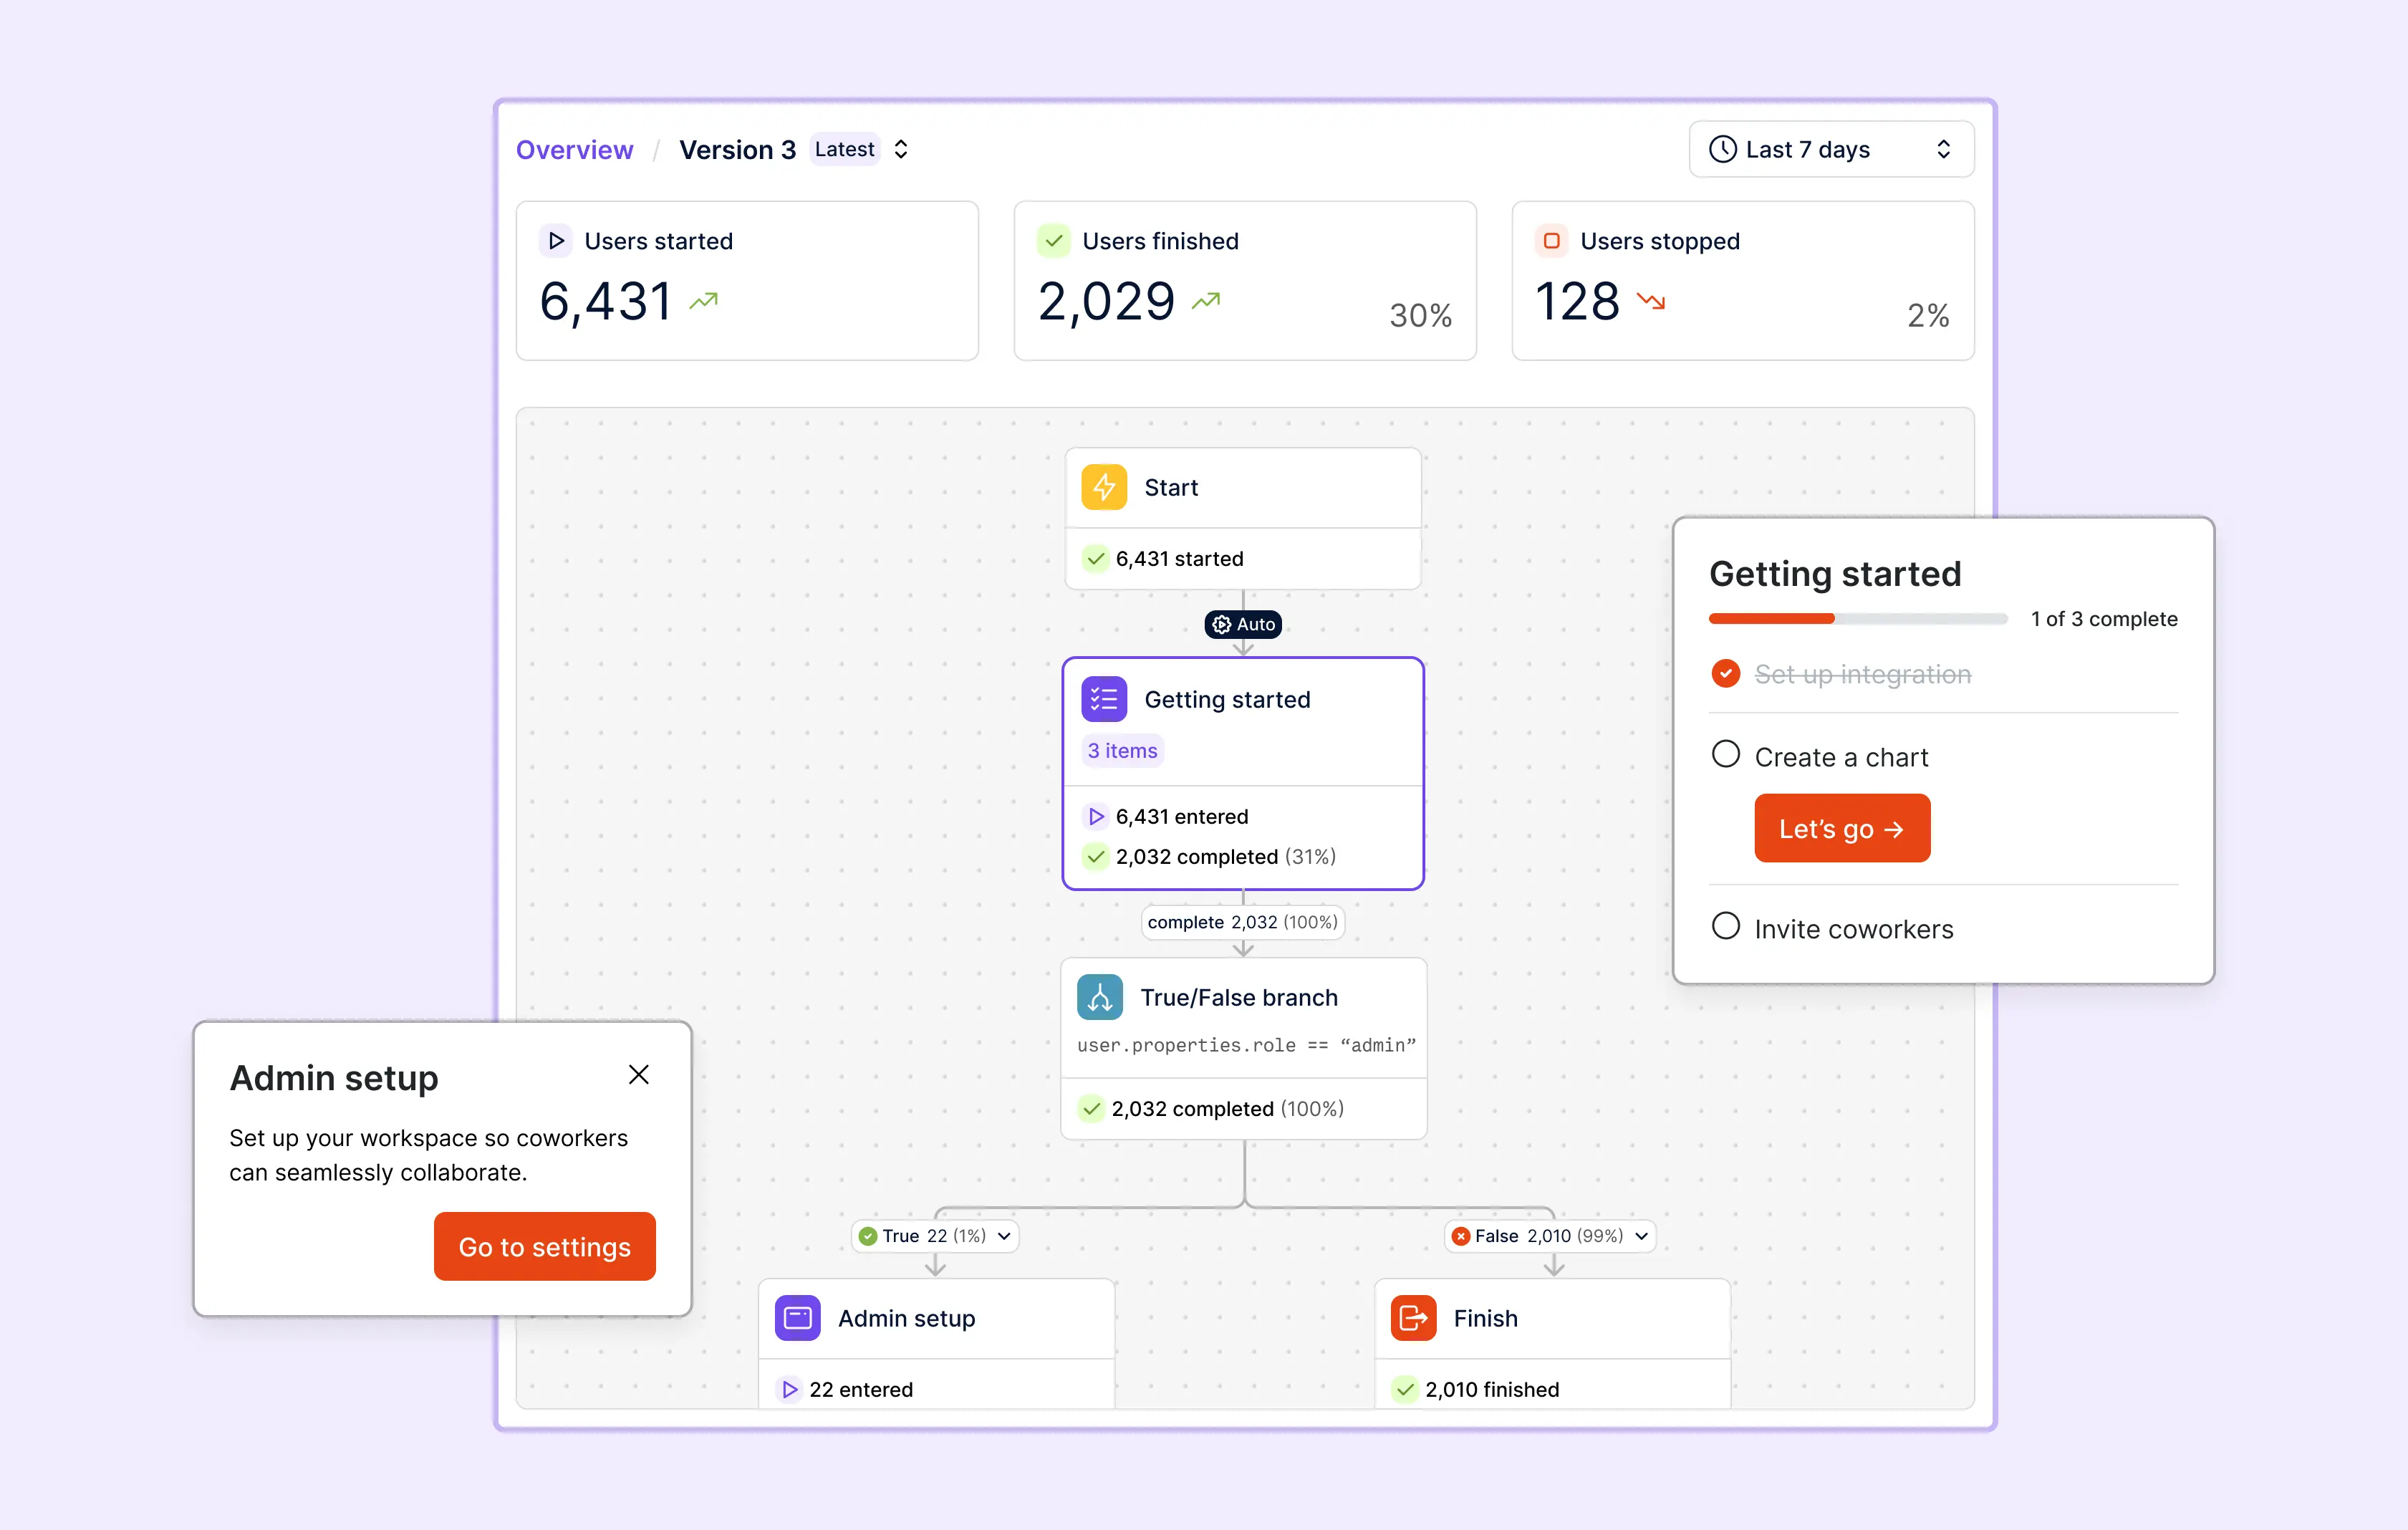
Analytics on the flow canvas - Dopt’s flow canvas makes it easy to map out your onboarding and education flow using Dopt’s blocks. The new analytics view is embedded directly into the visual flow canvas, making it super intuitive to understand performance.
Flow summary - Easily see total users started, finished, and stopped and overall completion rates.
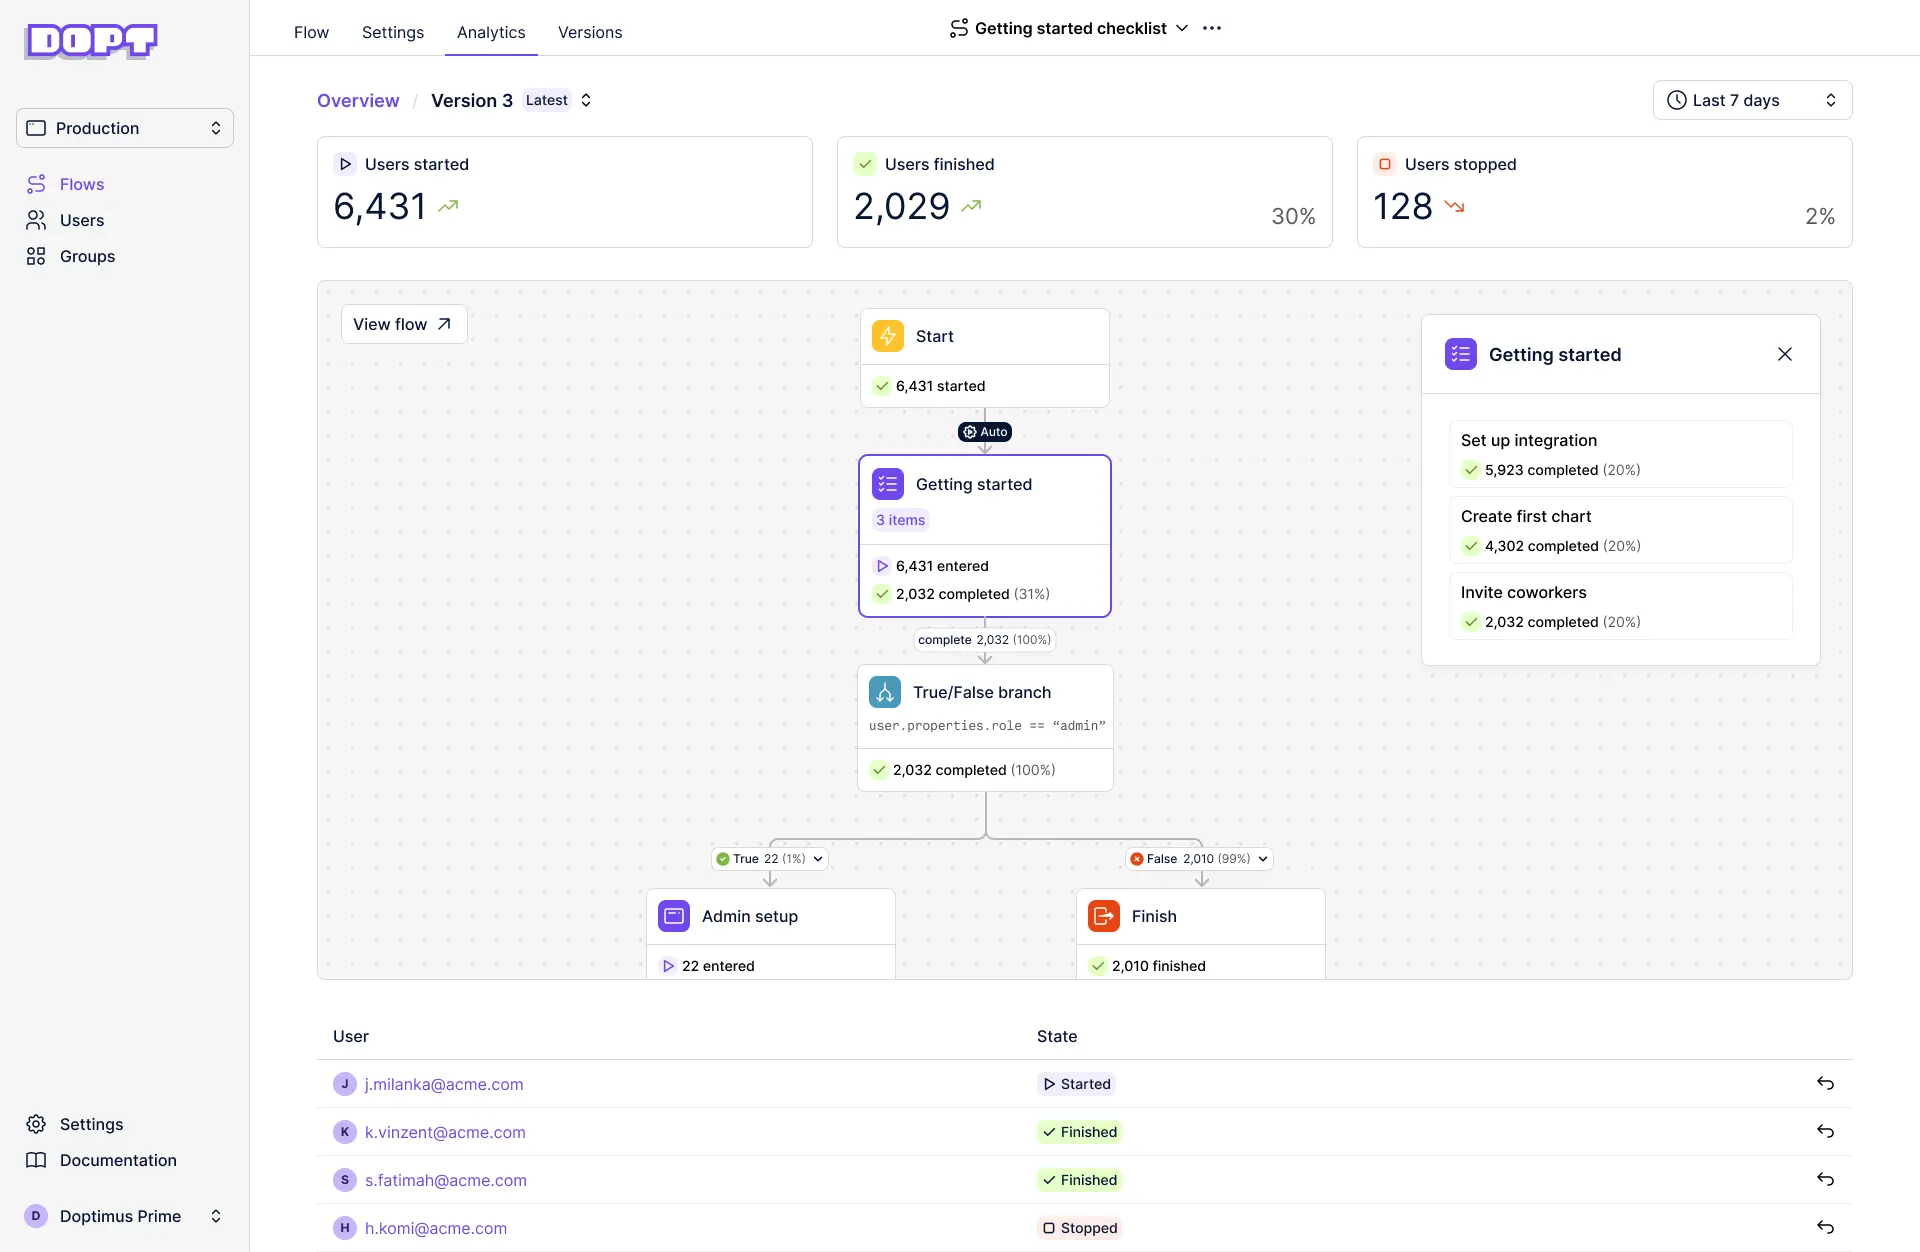
Step analytics - See which paths users take and step-level conversation rates, helping you see where users are converting or dropping off. Analytics on individual flow steps is particularly useful for checklists, tours, and hints where you can see which steps users are engaging with.
Time filters - View performance over different timeframes like last day or last 7 days. View trends from the last period.
View and search users - See individual users’ current state in the flow (started, in progress, stopped) and easily reset their state.
Compare flow versions - Understand how iterations have performed by looking at the analytics across different versions of the same flow, like version 5 compared to version 6.
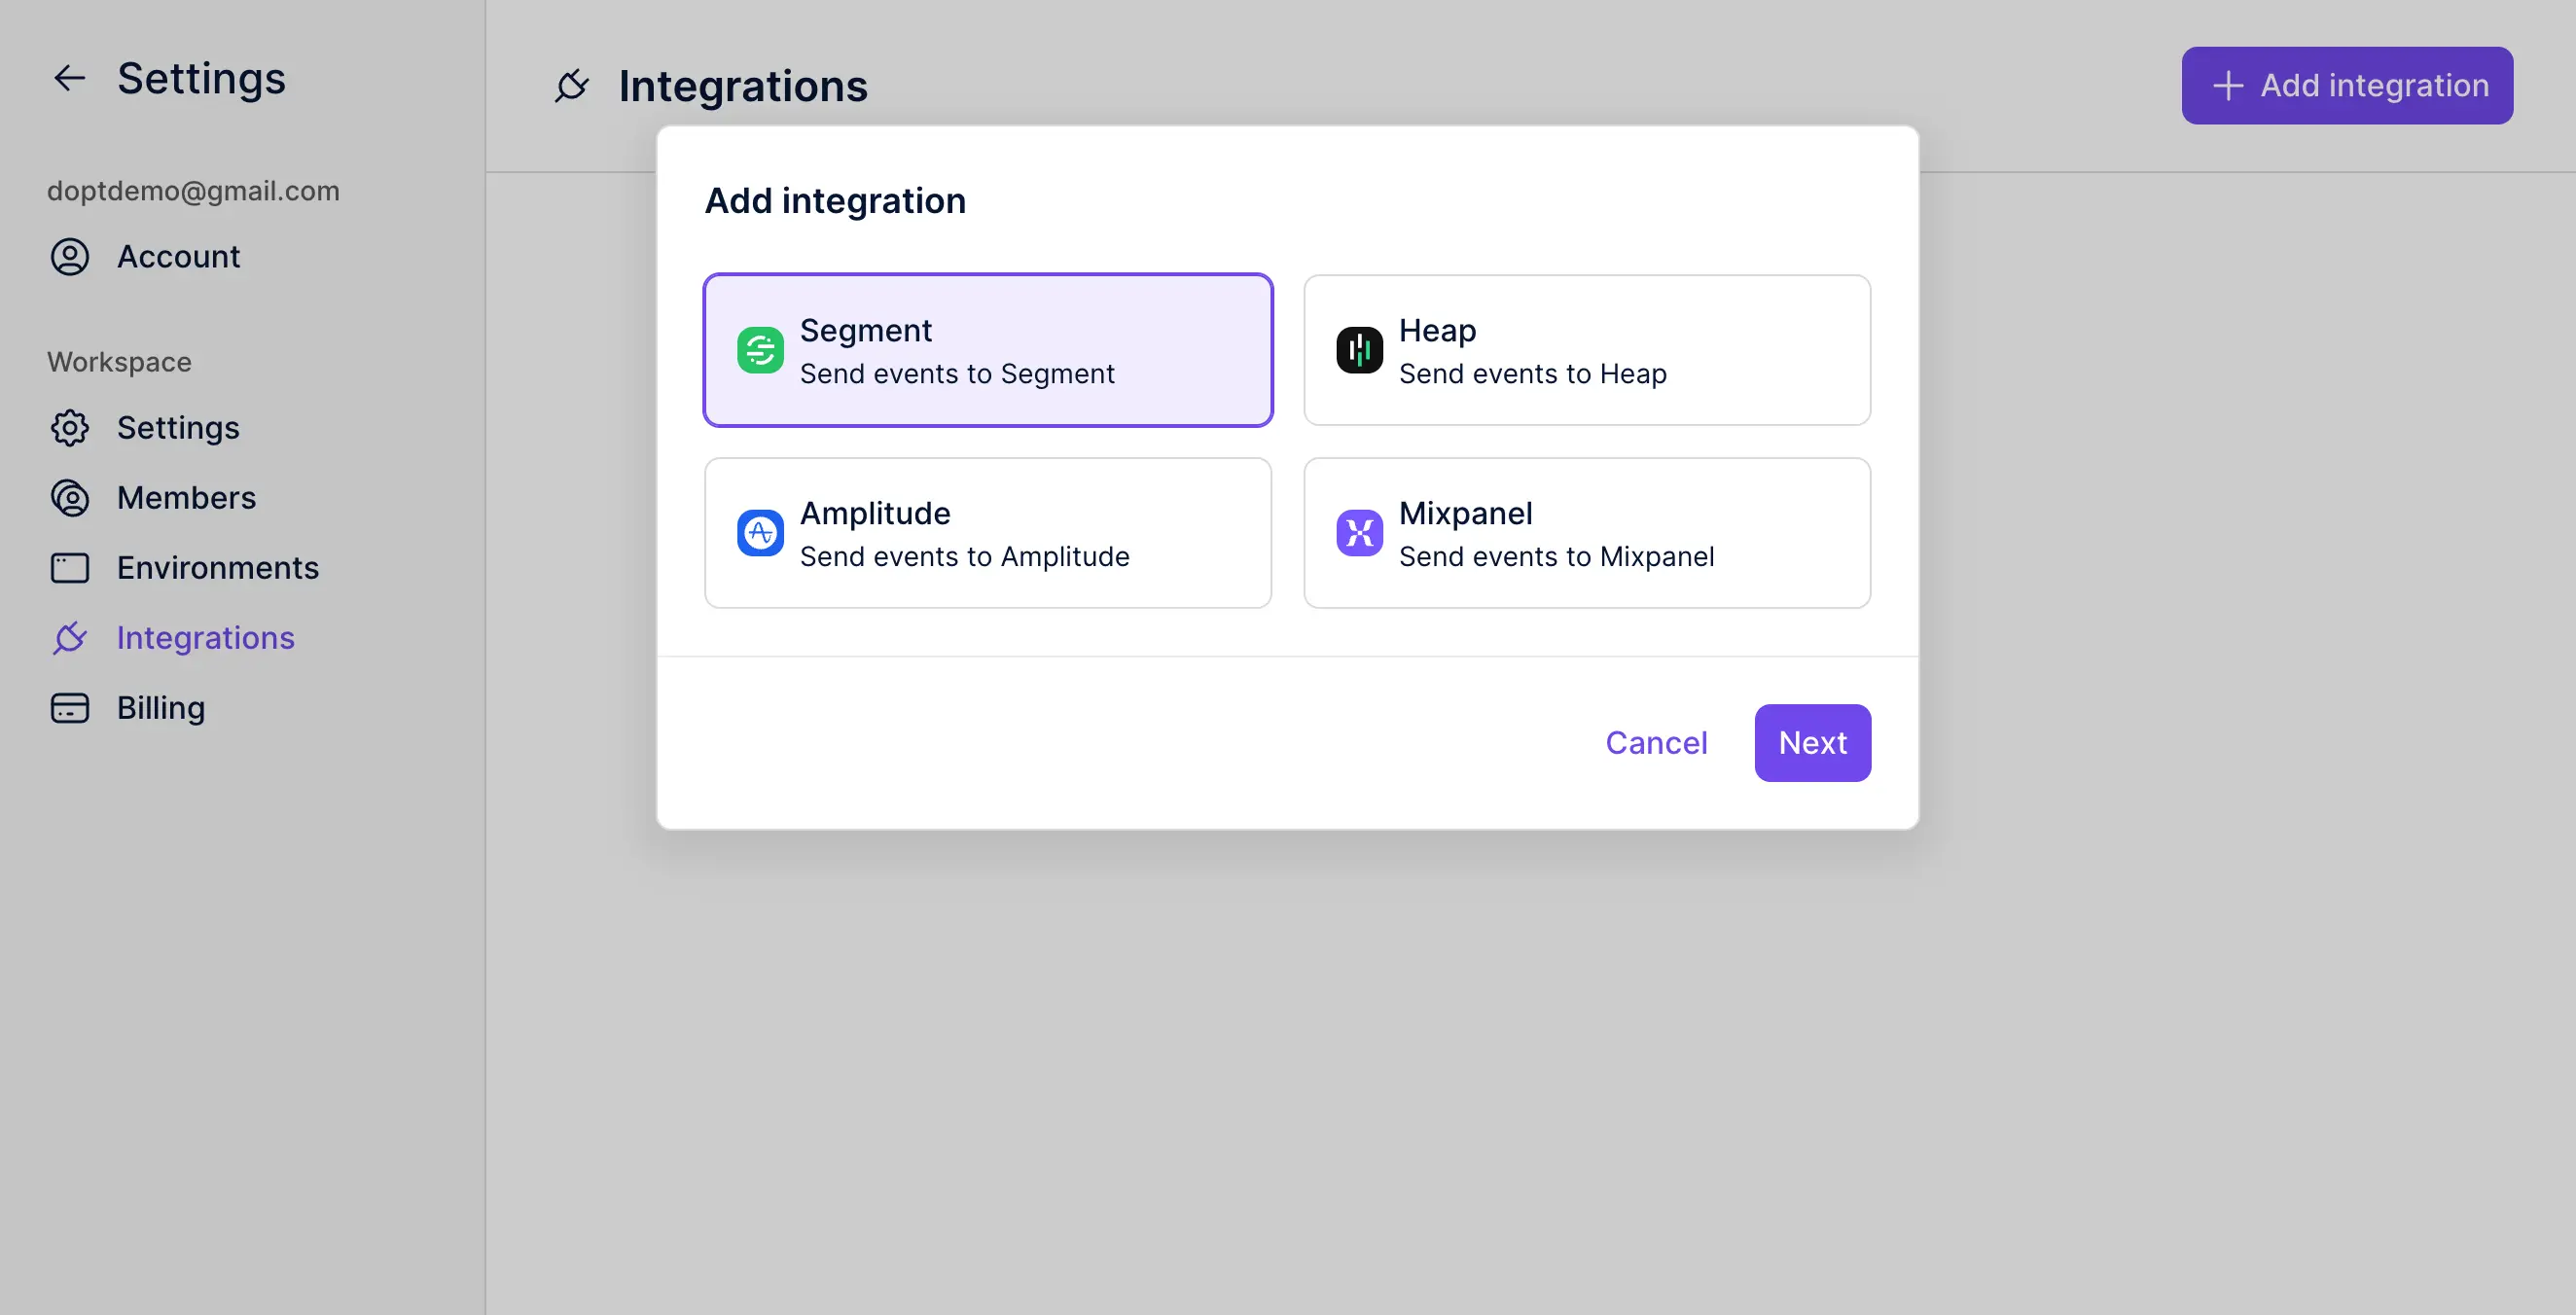
External analytics integrations - If you want to perform a holistic analysis across your Dopt flows and all of your other product data, you can send Dopt events to external analytics platforms with our Segment, Amplitude, Heap, and Mixpanel integrations.
Next steps
Dopt’s components and SDKs help you build better product onboarding and education.